 |
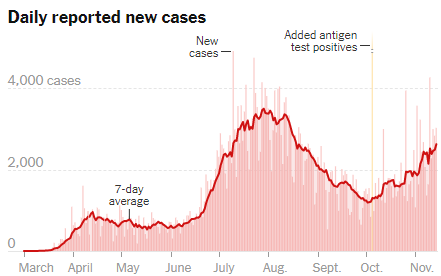
| Daily Reported New Cases In Georgia (Source: NY Times, Nov. 15, 2020) |
As a result, the 1918-1919 death graph more resembles the 2020 new case graph, as in Georgia's above, than the death graph.
Both graphs suggest that the deadliest time of the pandemic is right now, the winter months, which is otherwise flu season anyway and people spend more time indoors trading non-ventilated air and infecting each other.
I attribute the first, April peak in the current Georgia graph to the initial outbreak, and its decline to the shelter-in-place orders eventually issued in most states and municipalities. I attribute the second, July peak to the re-opening of the economy and "pandemic fatigue" when people just stopped social distancing, as well as to protests, rallies, and other super-spreader events, with the decline caused by a general awareness of the results of the protests, rallies, and other super-spreader events, and voluntary social distancing and more attention to hygiene (hand-washing) and wearing of face masks. I attribute the current and still-rising peak to school re-openings (secondary and colleges) and the start of winter weather and indoor activities.
This current peak probably won't decline until enough vaccinations occur to develop an immunity.


No comments:
Post a Comment